
Understanding USDA Plant Hardiness Zones
What USDA hardiness zones mean, how the map has shifted over a century, what it doesn't tell you about water — plus a free ZIP-code zone lookup tool.
Before you buy a single plant, learn one number: your USDA Plant Hardiness Zone. It's the most reliable shorthand for whether a plant can survive where you live — and it turns plant shopping from a gamble into a plan. This guide covers everything: how zones work, how the map has shifted over a century, what it doesn't tell you, and the fastest way to find yours — right here, by ZIP code.
Find your hardiness zone by ZIP code
Uses the current (2023) USDA Plant Hardiness Zone Map data.
Data: USDA ARS / PRISM via the open PHZM API. Borderline address? Confirm on the official USDA map.
What a hardiness zone actually is
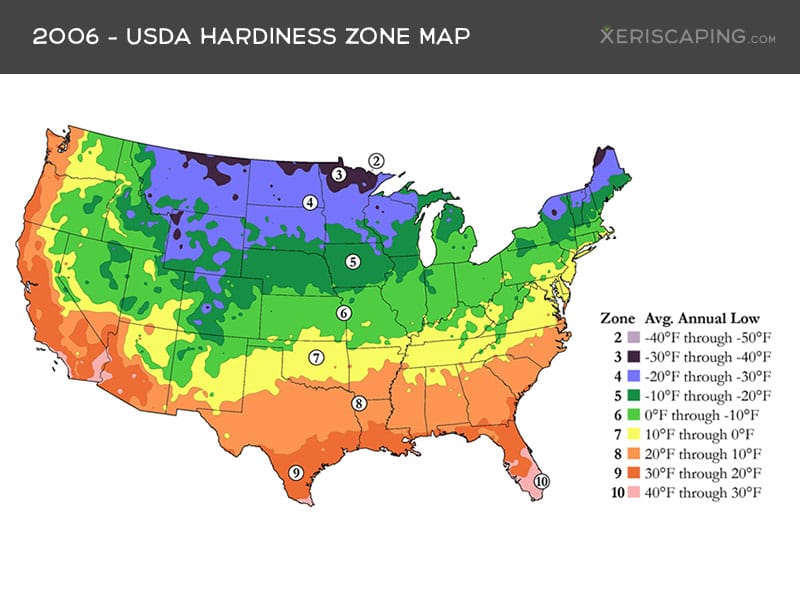
The USDA Plant Hardiness Zone Map divides North America into 13 zones based on the average annual extreme minimum winter temperature — essentially, how cold it typically gets in the worst part of an average winter. Each zone spans 10°F, and each is split into “a” and “b” halves of 5°F each. Zone 5b is 5°F milder than 5a.
Plant tags and catalogs list a hardiness range like “Zones 4–8.” If your zone falls inside that range, the plant can normally survive your winter. Outside it, you're fighting nature — and nature's record in that fight is excellent.
How the map is made
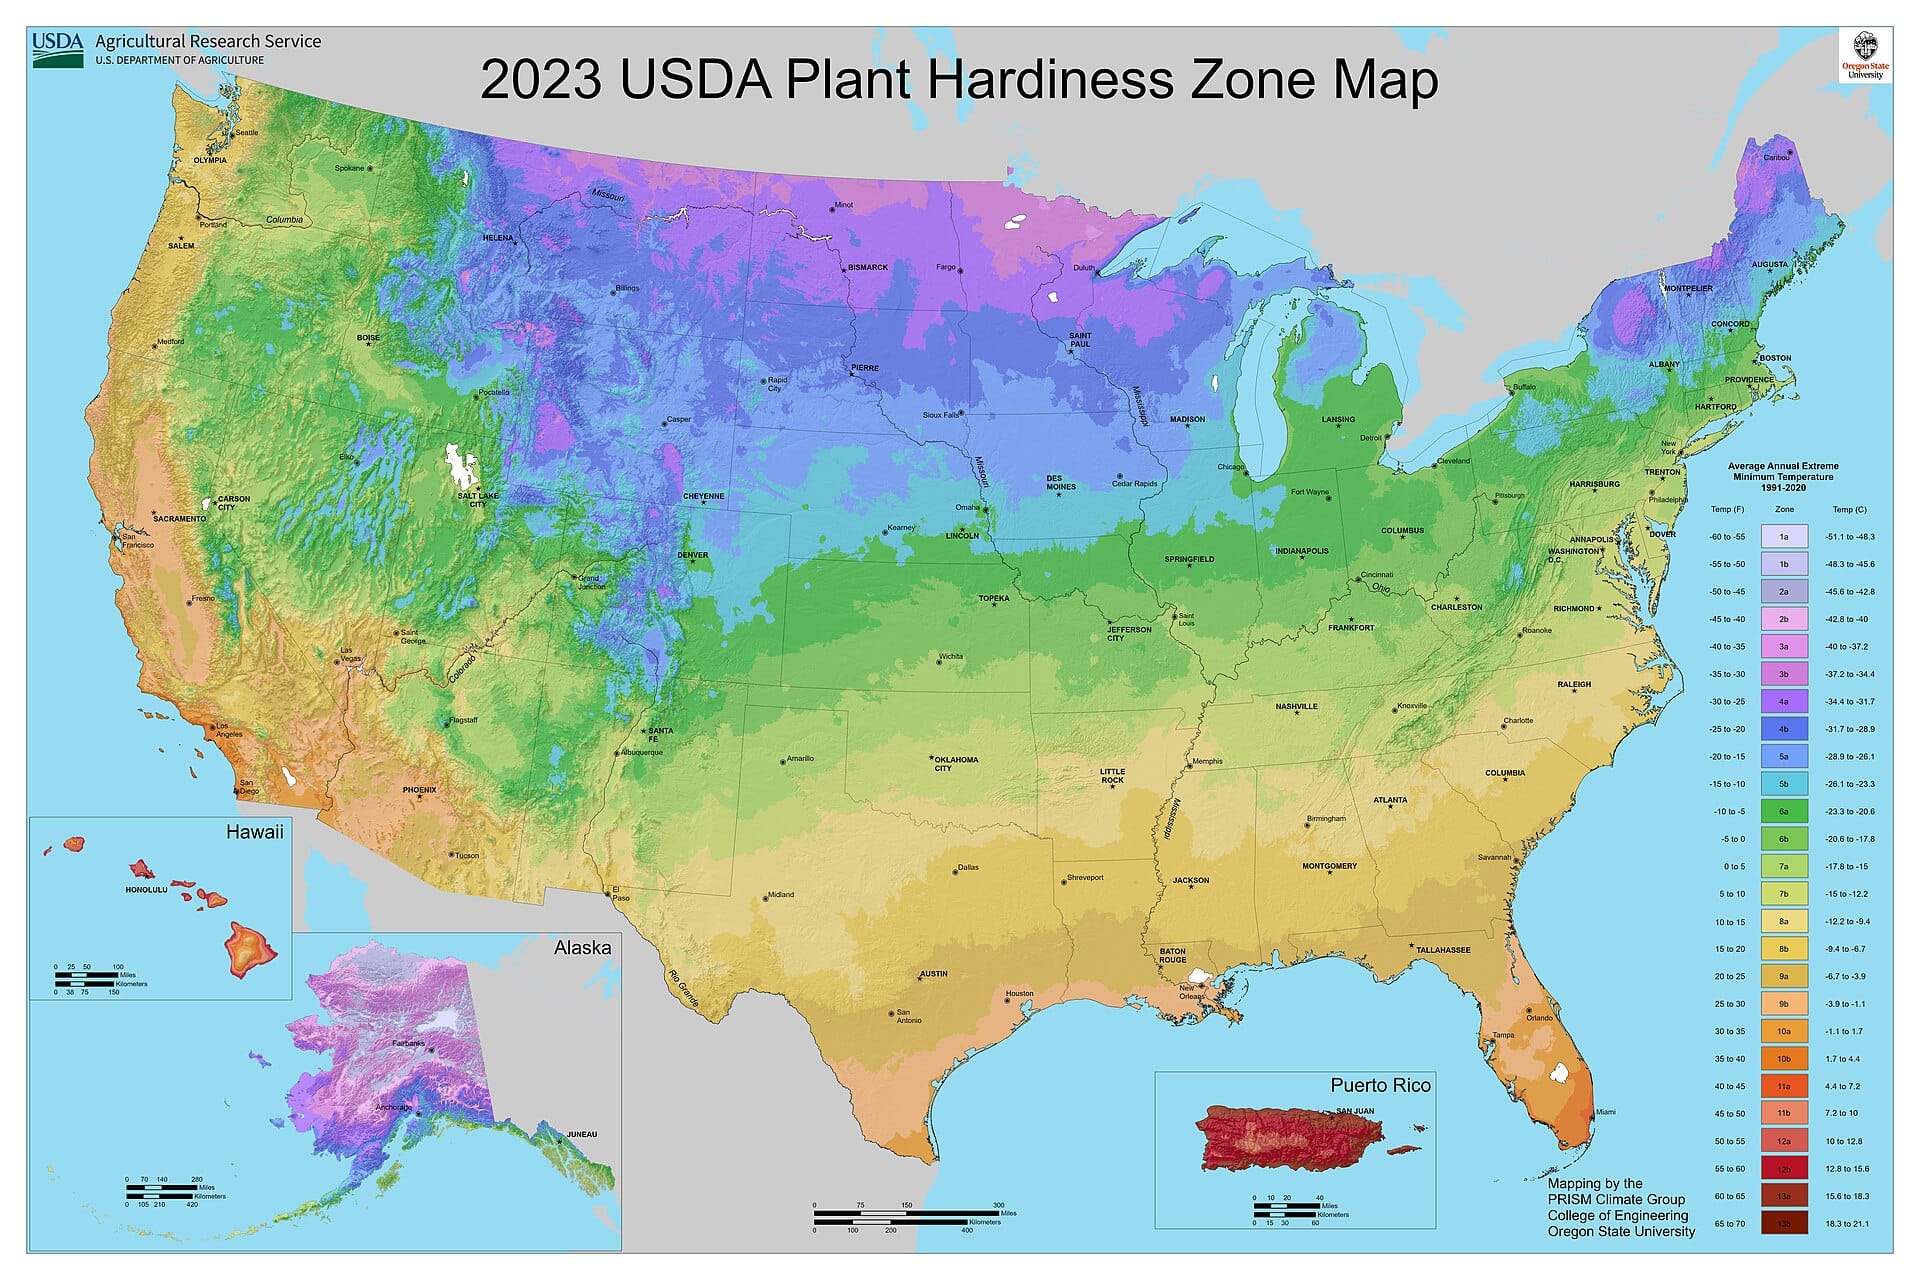
The current map, released in late 2023, was produced by the USDA Agricultural Research Service with the PRISM Climate Group at Oregon State University. It averages the single coldest night of each year over 30 years (1991–2020) at thousands of weather stations, then models the terrain between them — which is why the modern map captures mountain valleys, urban heat islands, and lake effects that older maps smoothed over.
Two things follow from the method. First, your zone describes a statistical winter, not a guaranteed one — a once-a-decade polar snap can undershoot it. Second, the "average coldest night" says nothing about summer, rainfall, or soil. More on that below.
The zones at a glance
| Zone | Avg. annual extreme minimum | Feels like |
|---|---|---|
| 3 | −40 to −30°F | International Falls MN, high Rockies |
| 4 | −30 to −20°F | Minneapolis, Cheyenne, mountain West |
| 5 | −20 to −10°F | Denver, Des Moines, much of the interior West |
| 6 | −10 to 0°F | Salt Lake City, Kansas City, Boise |
| 7 | 0 to 10°F | Albuquerque, Oklahoma City, Reno |
| 8 | 10 to 20°F | Austin, Dallas, Seattle, Atlanta |
| 9 | 20 to 30°F | San Antonio, Phoenix, Houston, Orlando |
| 10 | 30 to 40°F | San Diego, Las Vegas (10a edges), Miami, LA |
Zones 1–2 (Alaska and the coldest pockets) and 11–13 (South Florida, Hawaii, Puerto Rico) round out the scale.
The map keeps moving
Hardiness maps have been redrawn repeatedly over the last century — first as data improved, and more recently as winters warmed. Watch the same country change across sixty years:
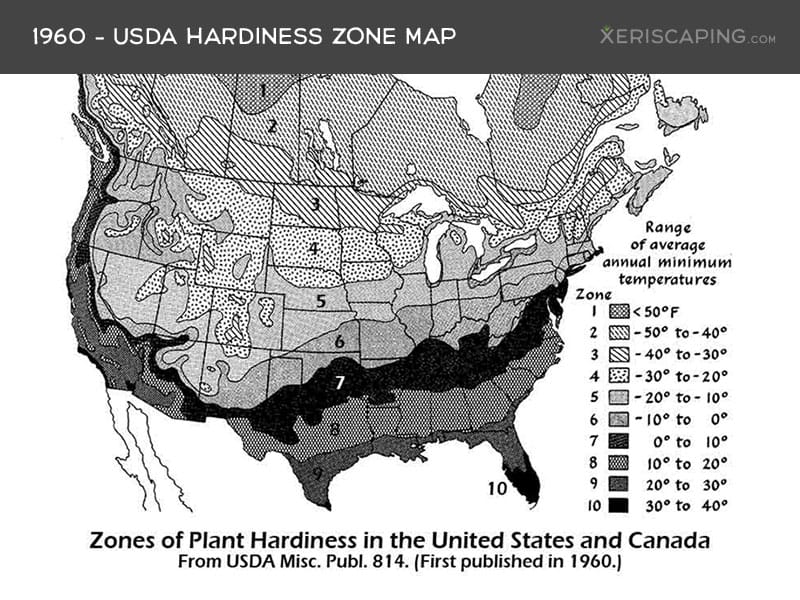
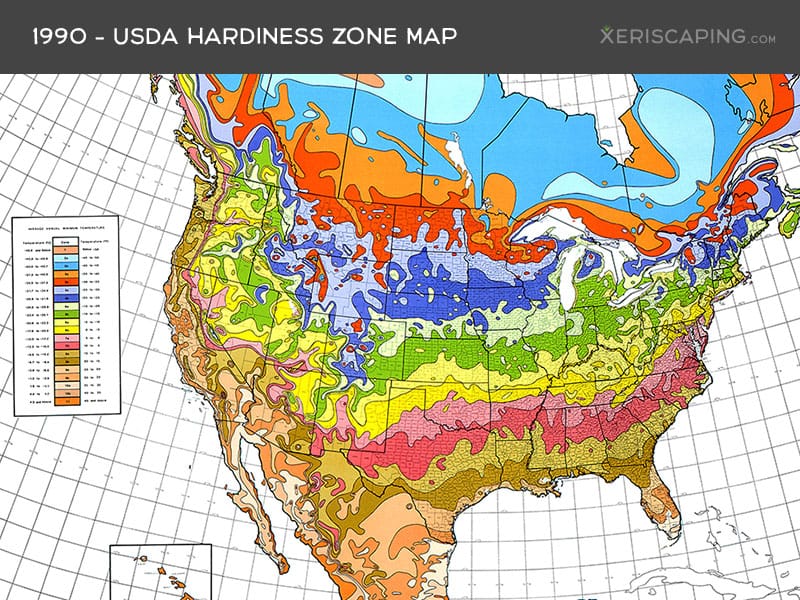
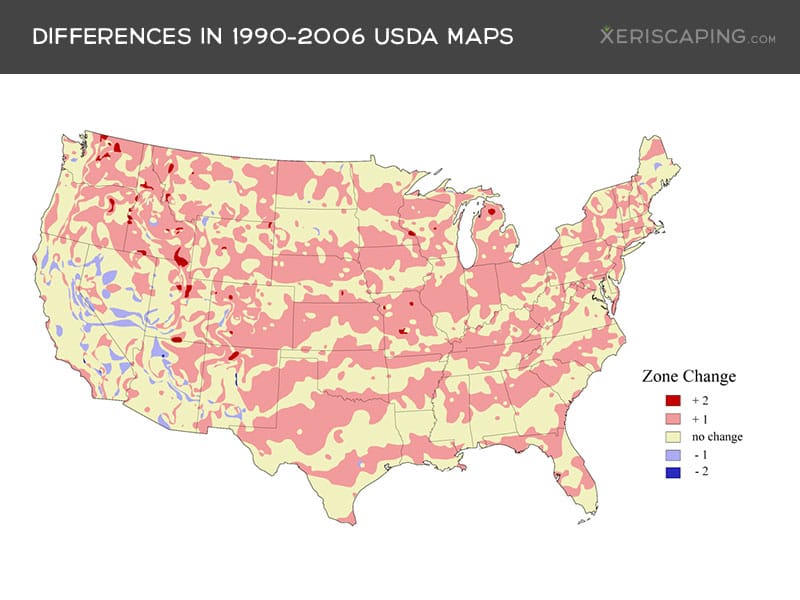
The pattern continued: the 2012 revision moved much of the country a half-zone warmer than 1990, and the 2023 map shifted roughly half of the U.S. another half-zone warmer again. The practical takeaways:
- Use the current map — the tool at the top of this page already does.
- Distrust old plant guides. A "not hardy in your area" note written against the 1990 map may simply be out of date.
- Don't over-trust the trend either. Warmer averages still include brutal outlier winters — the safe play for expensive structural plants (trees, big shrubs) is to stay rated to your zone, and gamble only on cheap perennials.
Hardiness is only half the story: water
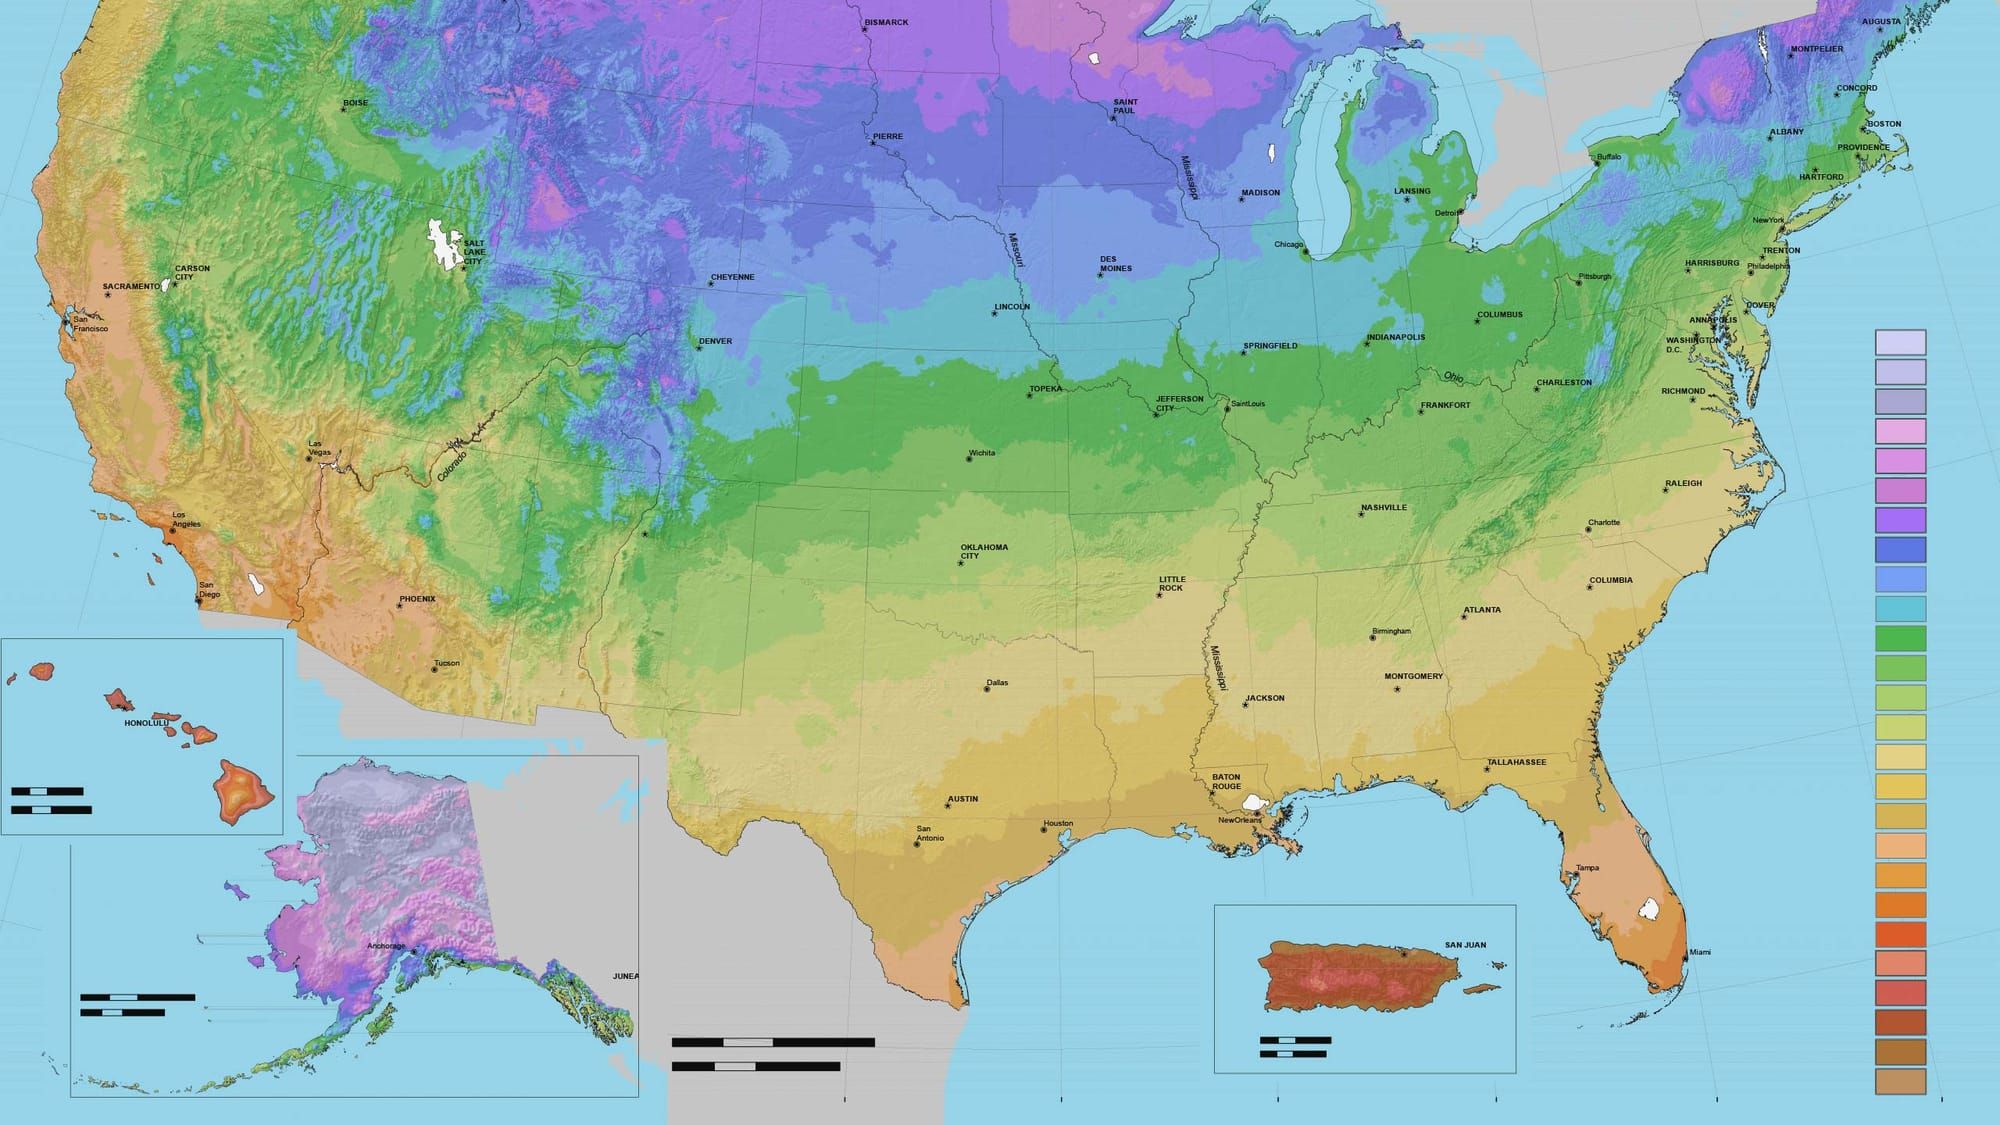
Two gardens can share a zone and live on different planets. Compare the zone map above with this one:
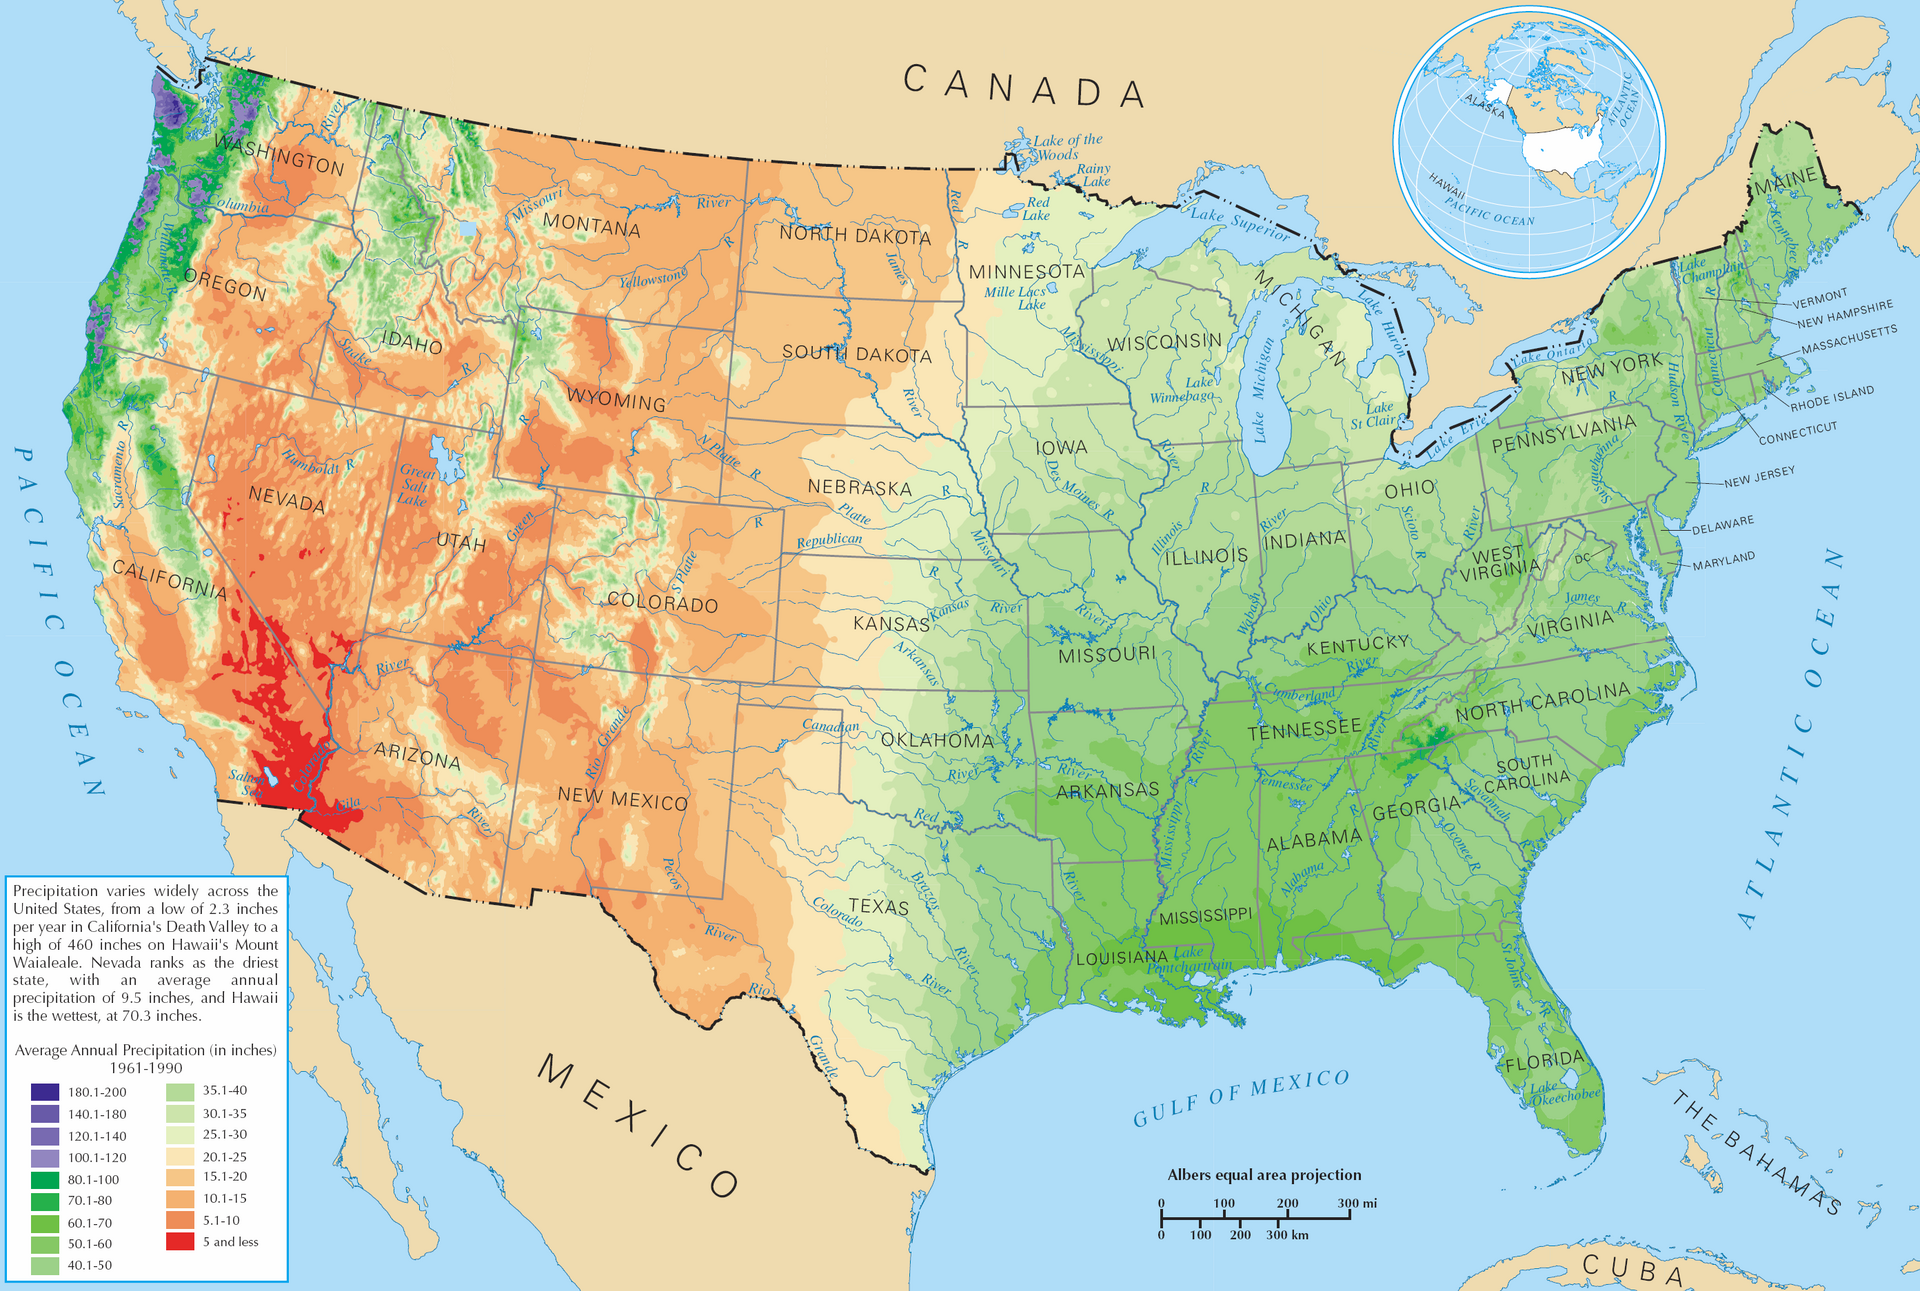
Zone 5 in Ohio gets 40 inches of rain a year; Zone 5 in Denver gets about 15. Same winter floor, utterly different water budget — and that's the half of the equation hardiness zones ignore. Your zone tells you what survives winter; your rainfall tells you what survives summer without a hose. Xeriscaping is what happens when you design for both honestly: zone-rated plants chosen from the dry side of the palette. That's the whole philosophy behind our Zone 5 and Zone 6 plant guides — and the 10 Steps method that puts them in the ground.
What else the zone map doesn't tell you
- Heat. A plant that survives a Zone 8 winter in Seattle may cook in a Zone 8 summer in Dallas. The American Horticultural Society's Heat Zone Map (days per year above 86°F) covers the other end of the thermometer.
- Humidity and disease pressure. Lavender that thrives in dry Colorado air rots in Gulf Coast humidity at the same zone rating.
- Soil and drainage. Many xeric plants die of wet winter feet at temperatures they'd shrug off in gravel. Drainage can matter more than the number — see our soil prep guide.
- Snow cover. Reliable snow is insulation; a snowless −15°F night is far harder on plants than a snow-blanketed −25°F one.
- The West's complexity. Along the Pacific coast and through the mountains, Sunset's climate zone system captures what one winter number can't. Use both if you garden out there.
Microclimates: your yard is several zones at once
The map's resolution stops at your property line — inside it, you're the cartographer:
- South-facing walls bank heat and run up to a half-zone warmer. That's the spot to push a borderline plant — our full-sun toughs love it.
- Wind-exposed corners and frost pockets (low spots where cold air pools) run colder than your official zone.
- Under eaves and evergreens stays drier — winter-wet-sensitive plants survive there.
- Pavement and boulders radiate stored heat — rock gardens exploit this deliberately.
How to use your zone (the short version)
- Look it up with the tool above — note the a/b half.
- Filter ruthlessly. Only buy plants rated to your zone or colder. For trees and investment shrubs, consider one notch colder for safety margin.
- Layer in water reality. From the zone-safe list, choose the low-water natives and adapted species — our perennials, grasses, shrubs, and trees guides are all zone-tagged.
- Spend your microclimates wisely — warm pockets for the borderline beauties, cold pockets for the bulletproof.
FAQ
What zone am I in? Enter your ZIP in the lookup tool at the top of this page — it uses the current 2023 USDA data.
Did my zone change in 2023? Roughly half of U.S. locations shifted a half-zone warmer versus the 2012 map. If you learned your zone years ago, re-check it.
Can I grow a plant rated one zone warmer? Sometimes — in a protected microclimate, with sharp drainage, and with the understanding that a hard winter may take it. Gamble with $12 perennials, not $300 trees.
Are zones the same as frost dates? No. Zones describe winter minimums; frost dates describe the growing-season calendar. You need both: zones for what to plant, frost dates for when.
Why do the same zone numbers feel so different in different states? Because zones only measure winter cold. Heat, rainfall, humidity, and elevation do the rest — which is why a Phoenix Zone 9b garden and a coastal California Zone 9b garden share almost no plants.
Know your number? Put it to work: start with Why Xeriscaping?, follow the 10 Steps, and browse plants proven for Zone 5 and Zone 6 — with more zone guides on the way.